Desmos for the SAT · Technique 14 of 15
Model Exponential Growth and Decay
Graph y = a·bx and read the starting value, the trend, and any future value.
Exponential questions on the SAT hand you a model like y = a·bx and ask for the starting amount, whether it grows or shrinks, or the value after some time. All three are sitting right on the graph.
Two numbers do all the work: a is the starting value (where the curve meets the y-axis at x = 0), and b is the factor it multiplies by each step. If b is bigger than 1 the graph grows; if b is between 0 and 1 it decays.
Type the model in exactly as written, using ^ for the exponent, and Desmos draws the whole story. Click any point to read the value at that time, no power arithmetic by hand.


Nova
Exponential models look scary, but the graph gives you everything: where it starts, whether it's growing or shrinking, and its value at any time. You just have to read the picture instead of powering through the arithmetic.
The algebra way vs the Desmos way
This technique sidesteps raising the base to a power by hand.
The algebra way
- Plug the time in:
400 · (0.5)^3. - Work the power, then multiply:
0.5^3 = 0.125, and400 · 0.125 = 50. - One slip on the exponent or the decimal and the answer is off.
The Desmos way
- Type
y = 400(0.5)^xand read the start value 400 off the y-axis. - Click the curve at
x = 3and read the value50.
The payoff: You read the start, the trend, and any future value straight off one graph, instead of computing a power for every value the question asks about.
See the move, live
That same example, already loaded in the real calculator, the one built into Bluebook on test day. Try the move yourself.
Quick reference
Reading y = a·bx
| Part | What it tells you |
|---|---|
| a (the y-intercept) | The starting value, at x = 0 |
| b greater than 1 | Growth, the curve rises |
| b between 0 and 1 | Decay, the curve falls |
| b = 1 + r | Grows by rate r each step, e.g. 1.2 is 20% growth |
Before you start: set up Desmos
Widen the axis bounds when the graph looks empty
Desmos opens on a small window from -10 to 10 on both axes. If a crossing, vertex, or data point sits outside that box, the graph can look empty even when an answer exists. Open the wrench icon and widen the x and y bounds until the point you need comes into view.
Step by step

Nova
Follow along one step at a time, hit Next as you go. I'll flag the spots where people slip.

Type the model exactly as given, using ^ for the exponent, e.g. y = 400(0.5)x. Press the right arrow to get back out of the exponent before you finish the line.
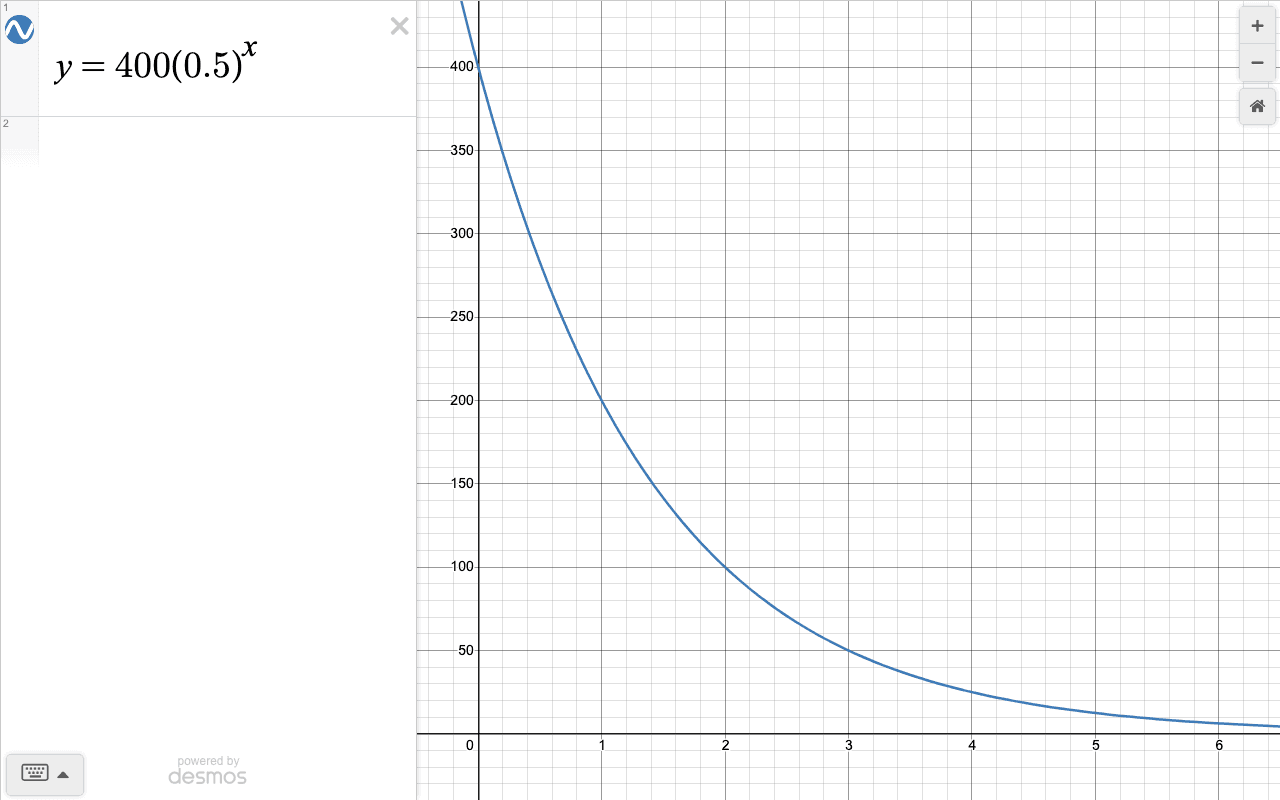
Syntax: Type the base in parentheses and the exponent with ^, then arrow out: 400(0.5)x. The y-intercept (the value at x = 0) is the starting amount a; a base above 1 grows, a base between 0 and 1 decays.
Now try it on a real SAT question
A bacteria colony starts with 50 cells and triples in number every day. The population is modeled by y = 50(3)x, where x is the number of days.
What is the population after 3 days?
Pick an answer to get instant coaching from Nova.

Growth by a factor each step is an exponent, not repeated addition. Type the model, click x = 3, and read it, no counting the triples on your fingers.
Graph y = 50(3)x and click the curve at x = 3, or compute 50 · 33 = 50 · 27 = 1350. The population after 3 days is 1350.
In the app, drills like this adapt to your level, and your AI coach can walk you through any step you get stuck on.

Nova
Growth by a factor each step is an exponent, not repeated addition. Type the model, click x = 3, and read it, no counting the triples on your fingers.
Set it up yourself in the blank calculator, then read the answer straight off the graph. Muscle memory beats watching.
The Desmos trap: when to close the calculator
- If the question only wants the starting value or whether it grows or decays, read a and b straight from the equation. No graph needed.
- For "how long until it reaches N", graph the model and the line y = N and find where they cross. That is the solve-by-graphing move.
- Watch compound-rate wording: y = a(1 + r)t uses the rate r, so the base is (1 + r). A 20% rate means a base of 1.2, not 0.2.

Nova
Gut-check first though: if the question only asks for the starting value or just growth-versus-decay, read a and b straight off the equation. That's faster than opening the calculator at all.
Put this move into real practice
"Model Exponential Growth and Decay" shows up all over the real SAT. SAT Prep Quest drills the skill at your level, so reaching for it becomes automatic by test day.
Practice freeSAT is a registered trademark of the College Board, which was not involved in producing, and does not endorse, this product. Score estimates are Learner Labs projections, not official College Board scores.